How much carbon does my server emit?
Have you ever wondered how much carbon your server, laptop, or virtual machine use? Well, I did, and in this article, I present you with the findings.
Hello!
It's been a while since I last wrote. The latest article should have been in your inbox last week. I missed the schedule. I apologize for that. I'll make an effort to stick to the current one of once every two weeks. Although, I'm considering posting articles in a more regular manner. We'll see how things unfold. For now, I'm returning to the every other Monday newsletter. It might be too much to change it.
With this and future articles, I want to scratch the surface of a topic that I find very interesting. It's a topic that is of great importance to us and our planet. I'm referring to the topic of green (sustainable) software. Some of the questions I am going to answer are - How can we contribute to reducing global warming? How can software engineers help the Earth? What do certain terms mean, and why are they important? These are some of the things and questions I want to explore through this and future articles.
We'll start with small things. We are going to answer a simple question: How much carbon does my server emit?
Why is this important?
By now, you should know a thing or two about global warming. If not, it would be a good idea to educate yourself further.
Here's a summary (a TL;DR one might call it). Earth is getting warmer and warmer due to emission of certain gasses. This is the greenhouse effect. And those gasses are, you guessed it, greenhouse gasses (or GHGs for short). Now, the warming by itself, shouldn't be a problem, right?
Nope, it is a problem. A big problem. The increase in Earth's temperature has a negative impact on us all. Both flora and fauna. And while there are many debates about who caused it, the main contributors to global warming are us - humans. I have written about global warming before, check out the link below to find out more.

Some studies show that the IT sector's contribution to global warming is between 1.8% and 2.8%. The belief is that this figure is much higher. This is because the entire life cycle and supply chain of equipment were not taken into account. Things like equipment, infrastructure, energy consumption during production... One of the sources for these figures is on the link below.
Although the above percentage seems insignificant, it is definitely much higher. That's one of the reasons for this article. I want to focus on carbon emissions into the atmosphere from the equipment we use. I want to educate myself and you, the reader, about something new. With the hope of contributing to sustainability and a greener future.
Why carbon?
Carbon is often used as a term to denote the impact of all types of emissions and activities on global warming. Other types of emissions include, for example, methane emissions. The term carbon often refers to all greenhouse gases (GHGs).
To determine the degree of impact of gases on global warming, we use carbon equivalent. Or CO2eq/CO2-eq/CO2e for short. In simple terms - one ton of methane has the same warming effect as 80 tons of carbon dioxide. We normalize that value to 80 tons of CO2eq.
How do we measure carbon emissions?
With the help of carbon intensity. This metric shows the emission of carbon per kilowatt-hour (KWh) of electricity consumed. The standard unit of measurement is grams of carbon per kilowatt-hour - gCO2eq/KWh.
To give you an example. Imagine you live near a wind farm. And your power grid connects directly to it. If you plug in your laptop to the outlet, the electricity used by it would have a carbon intensity value of 0 gCO2eq/kWh. This is because the wind farm does not emit carbon to generate electricity. Again, this is a simplified example.
Of course, in real life, this is not the case. Often, we do not have direct control over the grid and the sources from which we get electricity. This means that our carbon intensity is a mix of all the current sources of electricity on the grid. These sources can be higher-carbon or lower-carbon. The latter is what we want - lower carbon. In Serbia, unfortunately, the higher-carbon sources are dominant.
How to calculate the carbon intensity?
In short, this process is not that simple. There are many calculation methods mentioned on Wikipedia. Not wanting to recycle the content from other sources, I won't go into detail about those methods here. You can learn about them at the link below.
 Contributors to Wikimedia projects
For our example, let's consider the carbon emissions during actual equipment usage. To be exact, the well-to-wheels (WTW) method. I need to emphasize that this is an estimate. We cannot determine the exact carbon intensity of our machine in an easy way. The value depends on many variables.
For this example, I will use a simple Raspberry Pi 3 model B as the server. The first reason - it's because I have it laying in my apartment for some time. The second - it's because I want to save you some time. I don't want to go into details of many resources on different cloud providers. Whether they are Version A, Generation X, or whatever comes to mind, it's not important for this article. They exist only to confuse you.
Below are the most important specs of the Raspberry Pi I'm using.
- Quad Core 1.2GHz Broadcom BCM2837 64bit CPU
- 1 GB RAM
- BCM43438 wireless LAN and Bluetooth Low Energy (BLE) on board
- Micro SD port for loading your operating system and storing data
- Upgraded switched Micro USB power source up to 2.5A
So, we have 1.2GHz quad-core CPU, and 1 GB of RAM. That should be enough for this example. For full specs, check out the link below.
 Raspberry Pi Ltd
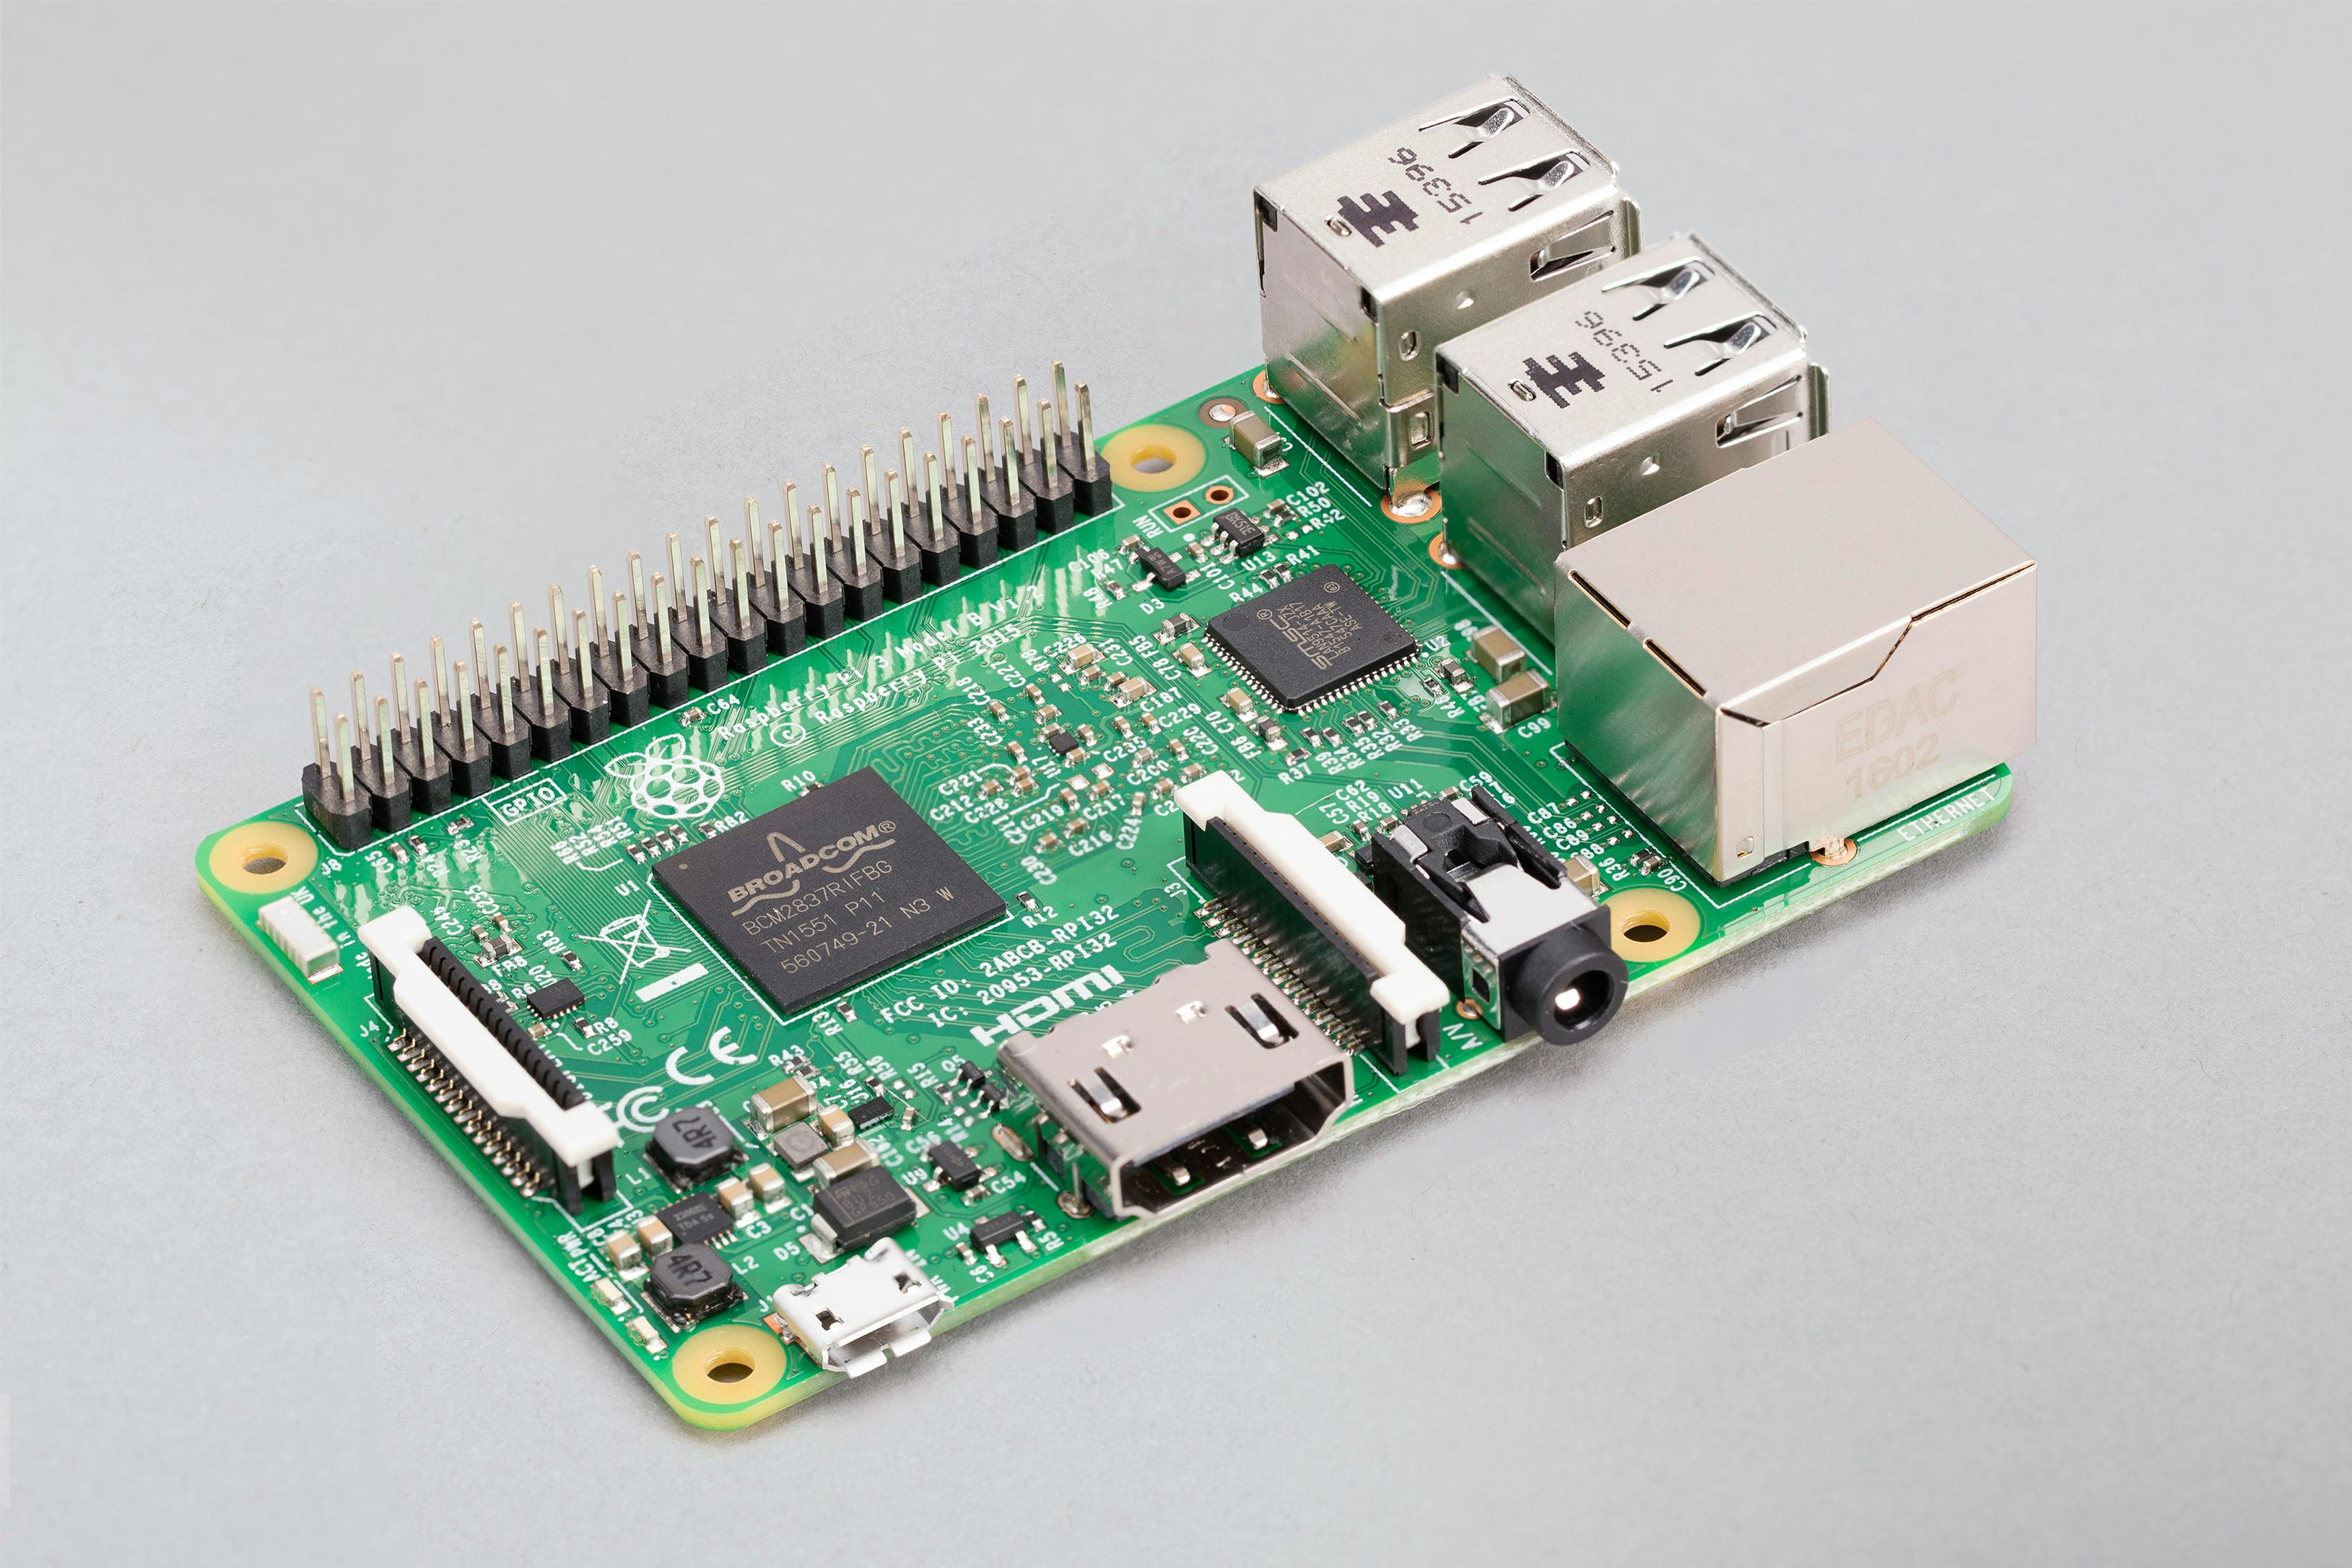
I admit, the term server is rather loose in this article. But, I do consider Raspberry Pi a type of server. It is compact, and enough for some operations. It often comes without a graphical interface (as it should). Last, but not least - it's running the Linux operating system.
Now, how much power does the Raspberry Pi consume? Searching the internet, I came across a figure of 3.6 Watts. That is, if the Pi is not working in idle mode. The energy consumption for a whole day would be approximately 86.4 Watts per hour (Wh). In kilowatt-hours, that is 0.0864 kWh. The link below provides more information.

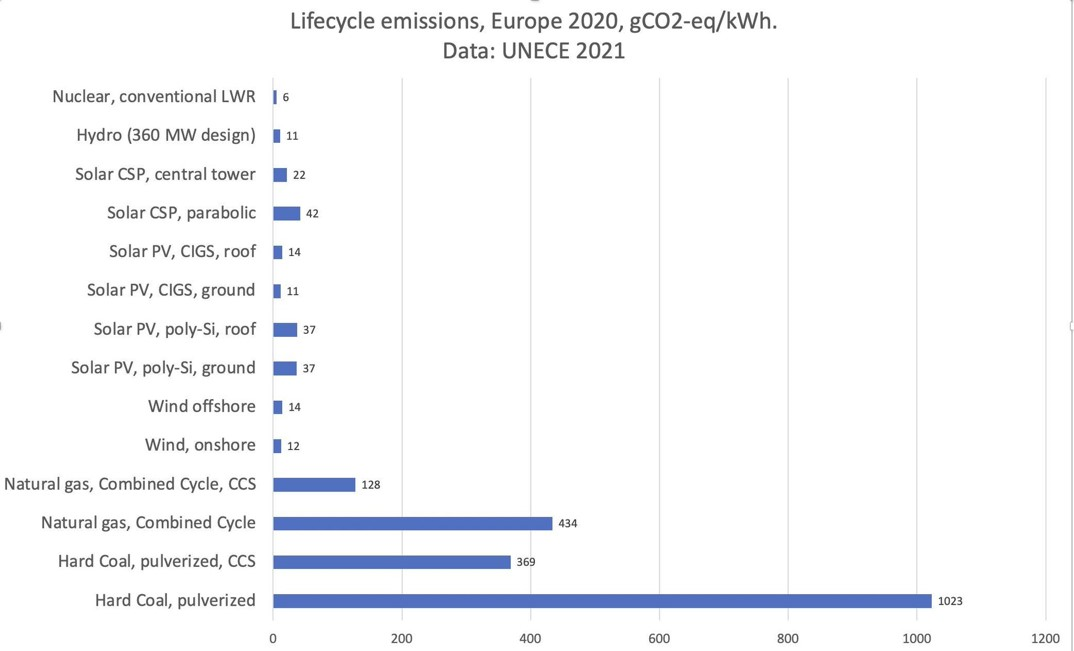
Next, a bit more complex part of the calculation - the source of electricity. Each source of electricity carries a certain gCO2eq emission into the atmosphere. We need to make sure we take all into account. The image below shows the estimated emissions for different energy sources.
Based on the report from 2022, the electricity production in Serbia varies a bit. The most dominant is the production from thermal power stations. The second is from hydroelectric power stations.
You can find the reports linked below. Sorry for the Serbian version, I wasn't able to find the English one.
The graph below shows the electricity production in 2022 per month. The blue line shows the hydroelectric and the brown is from thermal power stations.
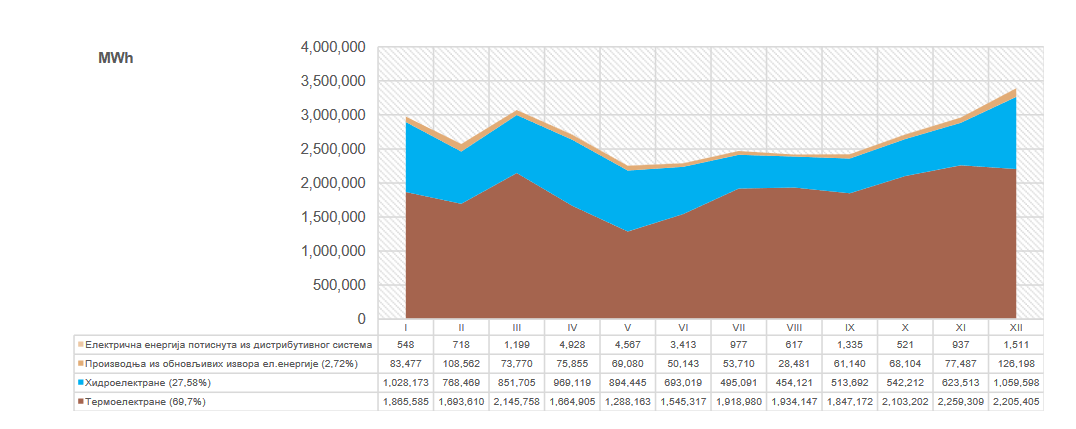
So, roughly 2/3 of the consumption emits around 1000 gCO2eq/kWh, and 1/3 of the consumption emits around 11 gCO2eq/kWh.
The calculation would look like this:
(0.0864 kWh x 2/3) * 1000 gCO2eq/kWh + (0.0864 kWh x 1/3) * 11 gCO2eq/kWh = 57.9168 gCO2eq
If I let the Raspberry Pi run for the whole day, it would have emissions of around 58 grams of CO2 equivalent. Not bad, you might think?
Well, I wouldn't exactly say so. Consider the size and power of the device itself. The weight of the Raspberry Pi is ~300g, and its power is 3.6 Watts. Even though the consumption is low, the amount of carbon it produces is not negligible. In other words - during its full-day operation, it emits almost 1/5 of its weight in CO2eq. Thanks to electricity sources in Serbia.
A simple calculation, right? Well, sort of. Some information wasn't easy to find, though... These values might not be exact, and for sure may vary. This number could be higher. Since I live in Belgrade, where the main source of electricity is a thermal power station. But, I wanted to stay as unbiased as I could, based on the values I found.
Key takeaways
As I mentioned above - these calculations are approximate estimates. Based on the information I gathered from the internet. They are not exact. They might be worse, but one can hope.
Some of the key takeaways from this article, for both you - the reader and me - the author, are the following:
- Carbon - a term often used to encompass all Greenhouse Gasses (GHGs).
- Carbon equivalent - the warming effect of a GHG expressed in a warming effect of carbon.
- Carbon intensity - a metric that shows emission of carbon per kilowatt-hour (KWh) of power consumed. The measurement unit is gCO2eq.
- Carbon intensity depends on energy sources.
- Transparent data about energy production is necessary to calculate carbon intensity.
That's it for now. I hope you found this article informative.
Let me know in the comments below what you found the most interesting. Is there any information you'd want to share? Do you find the numbers and calculations I presented above wrong?
If you received this article by e-mail, forward it to somebody who will find this topic interesting. Also, feel free to share the article, it would mean a lot!
See you in the next issue!