How to scale pods based on Carbon Intensity?

Listen to me read this post here (not an AI-generated voice!) or subscribe to the feed in your podcast app.
Like every other spam e-mail of the service you've forgotten you signed up to, I want to start this article with:
Hi there, it's been a while!
And it certainly is. Or was. I don't know. English is not my mother language. But that's not important.
What's important is the article you're reading. The idea for it came to me quite organically, sort of like a duh moment. I held a talk recently at Heapcon 2025 in Belgrade, on the topic From Kubernetes to Low Carbonetes: Optimizing Infrastructure and Workloads for Sustainability. There I demoed briefly a setup where I scaled the application based on the Carbon intensity of the grid. Here is where the duh moment was - I could write a deeper dive into what I've done. And here we are.
One short trivia before we continue - if you are a keen follower of my writings, you might have noticed that the title of the talk sounds familiar. Yes, I've already written on this topic some time ago. In that article, as in my talk this October, I covered some basics, and practical steps on how you can reduce your Carbon footprint within your Kubernetes clusters.
With this article, however, I want to document the demo I had prepared for the Heapcon talk. Here we'll go into a deeper explanation of the things I used for the demo, and how I set everything up on my local machine. Feel free to scroll down to the bottom for the link to the repository where I put everything demo-related.
Overview
Every good 8 seconds cooking recipe starts with an overview of the dish you're going to prepare. I will try to do a similar thing with the following screenshot. And I hope it will be enough to show you in a nutshell what I've created.
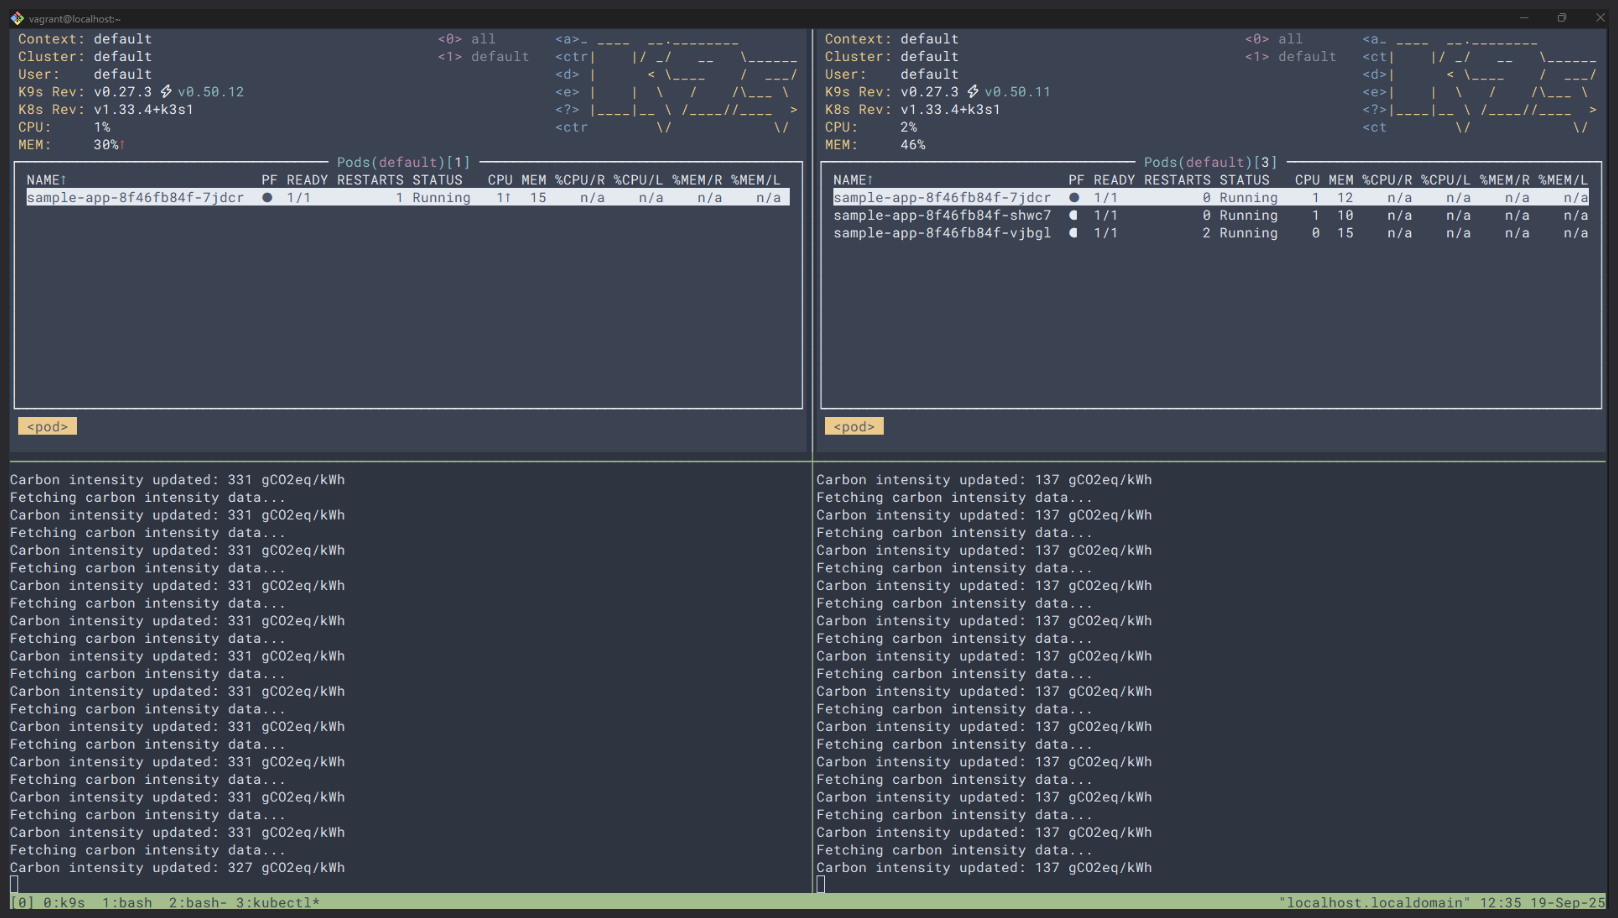
On the left-hand side you can see one replica of the resource and below its data about Carbon intensity. On the right-hand side, you can see three replicas, while the Carbon intensity is lower.
In a nutshell, here I'll show how I used data from Electricity Maps API and created a scaling point for resources, based on the overall Carbon intensity of the grid.
Ingredients
Keeping the 8-second cooking recipe story from above alive, in the next bullet points I'll show you what I used and to what extent.
- 1 x Locally run k3s cluster.
- 1 x Prometheus deployment (kube-prometheus-stack).
- 1 x KEDA installation and configuration.
- 1 x Electricity Maps API account.
- 1 x Simple Node application.
Locally run k3s cluster
The k3s cluster is a light-weight implementation of Kubernetes, that you can easily spin up on your machine by following quite thorough instructions on the official k3s website.
Since I needed the cluster only for the demo purposes, I followed the quick start below.
Prometheus deployment
Now, this was a no-brainer for me. I've been using quite extensively the Prometheus/Grafana monitoring stack on the Kubernetes, therefore I've installed a default setup of kube-prometheus-stack helm chart.
This is a collection of Kubernetes manifests, Grafana dashboards, and Prometheus rules combined with Prometheus using Prometheus Operator. It was easy to follow and to set it up quickly.
KEDA installation
In order to be able to scale on external events, I needed to add KEDA - Kubernetes Event Driven Autoscaler. In a nutshell, this tool will monitor your resources for any external events, say, Carbon intensity of the current power grid, and scale the resources based on the thresholds you've defined.
Again, documentation is quite good, and the whole setup was quite easy to follow from the following link.
Electricity Maps API Account
The Electricity Maps is the most useful platform where you can get the electricity data from. With the free account, you can get the relevant electricity data from one region. Which makes sense, because you can use this opportunity to test out the platform and see how can you use it in your workflow.
To create an account, just visit the following link, and follow sign up instructions.
After you've created an account, you can play around on the platform. The most important part for us is the Developer Hub tab. Here you can find the data about your API authentication token, which you can use in the code.

Simple Node application
The last step in the process is to create an application that can use this data. I've created a simple JavaScript server that takes the data from the Electricity Maps on latest Carbon Intensity, logs the numbers to standard output, and exports the values as Prometheus metrics.
This is an important step, because the scaling will depend on metrics from this service.
The application is located in the repository under /app/server.js directory.
I've created a docker image, and deployed the application as a Deployment in a default namespace.
Mixing it all together
Having deployed everything from the above will bring us two steps closer to the solution from the beginning.
There are two steps that we're missing here:
ServiceMonitor- a resource that tells Prometheus to scrape the metrics from thesample-app:80/metricsURL.ScaledObject- a resource that tells KEDA what to scale and on what grounds. This is the part I was having troubles the most.
Configuring correct scaling
The ScaledObject resource is quite powerful and if not set up correctly, it can lead to various problems. For example - whenever one request goes to the application, and the resources increase for just a bit, workload is scaled to n replicas.
In my example, I wanted to scale up on lower Carbon intensity, and scale down on higher Carbon intensity numbers. This required me to use the inverted logic on the ScaledObject. Because, by default, KEDA expects that when some numbers increase, it considers increasing the number of replicas.
Below you can see the example of the ScaledObject I used.
apiVersion: keda.sh/v1alpha1
kind: ScaledObject
metadata:
  name: carbon-intensity
  namespace: default  # Adjust to your namespace
spec:
  scaleTargetRef:
    name: sample-app  # Replace with your deployment name
  minReplicaCount: 1
  maxReplicaCount: 10
  triggers:
    - type: prometheus
      metadata:
        serverAddress: http://prometheus-kube-prometheus-prometheus.prometheus.svc.cluster.local:9090
        metricName: carbon_intensity_green_energy
        threshold: '50'
        activationThreshold: '1'
        # Inverted logic: higher value when carbon intensity is lower (greener)
        query: (250 - avg(carbon_intensity_gco2_per_kwh))
As you can see on the example above, the inverted logic is handled by the query option. This is how it will work:
- When Carbon intensity = 150gCO2eq/kWh - query returns (250-150) = 100 -> Scale to ceil(100/50) = 2 replicas.
- When Carbon intensity = 300gCO2eq/kWh - query returns (250-300) = -50 -> KEDA treats this as 0 and scales it to
minReplicaCount= 1 replica.
Summary
It was quite easy for me to set this up by following quick-start guides, which are so good these days. However, this might and will differ from your use case. Fortunately, Electricity Maps API offers quite a lot of different data that you can use and act upon. In my example, I've used only basics.
For more information about the code and infrastructure I've deployed, check out the following repository.
Hopefully you can test it out yourself and can provide some feedback on the topic!
See you in the next article!