Demoing Kepler Exporter
Have you ever wondered if you can track the power consumption of your machines? The short answer is - yes! The "how?" question is the interesting part of it. And we dive into that, and many more, in this article!
Hi everyone!
In this week's article, we'll be doing a walk the walk, rather than just talk the talk. I'm going to show you how using a tool called Kepler can provide you more insights in power consumption of (not just) Kubernetes cluster nodes and machines. With that, we'll get predicted Carbon emissions, so, it's going to be interesting. At least to me.
We'll start from the beginning, explaining what Kepler is and how it works. Then, we'll dive into how to set it up, and in the end, we'll show what all those metrics mean in a comprehensive Grafana dashboard.
So, let's dive in!
What is Kepler?
First, I'll start with a note to myself. The tool Kepler is not a similar thing to Keda. Kepler is a Prometheus exporter, and Keda is a Kubernetes Event-driven Autoscaling. A scheduler on steroids, basically. I'm going to check Keda out in some of my future articles, so, stay tuned!
The tool didn't get its name from Johannes Kepler. Rather, Kepler in this context stands for Kubernetes Efficient Power Level Exporter. In a nutshell, it is a Prometheus exporter that uses eBPF to probe energy-related system stats and exports them as metrics.
To cover some basics - Prometheus is a monitoring tool that uses a pull-based method to gather metrics from various endpoints. An exporter is a tool that exports the underlying systems' metrics for Prometheus to scrape them.
And what is eBPF? In short, it is a technology with origins in the Linux kernel. The main feature is that it can run sand-boxed programs in a privileged context. It is used to extend capabilities of the kernel, without the need to change the kernel source code or load kernel modules.
To explain fully the eBPF, and how it works, we would need a separate article. And I'd need to research about the internals of the Kernel. So, we're not going to spend more time on it. At least in this article. If you're interested to read more, check out the eBPF documentation.

How Kepler works?
Following is the architecture diagram of Kepler.
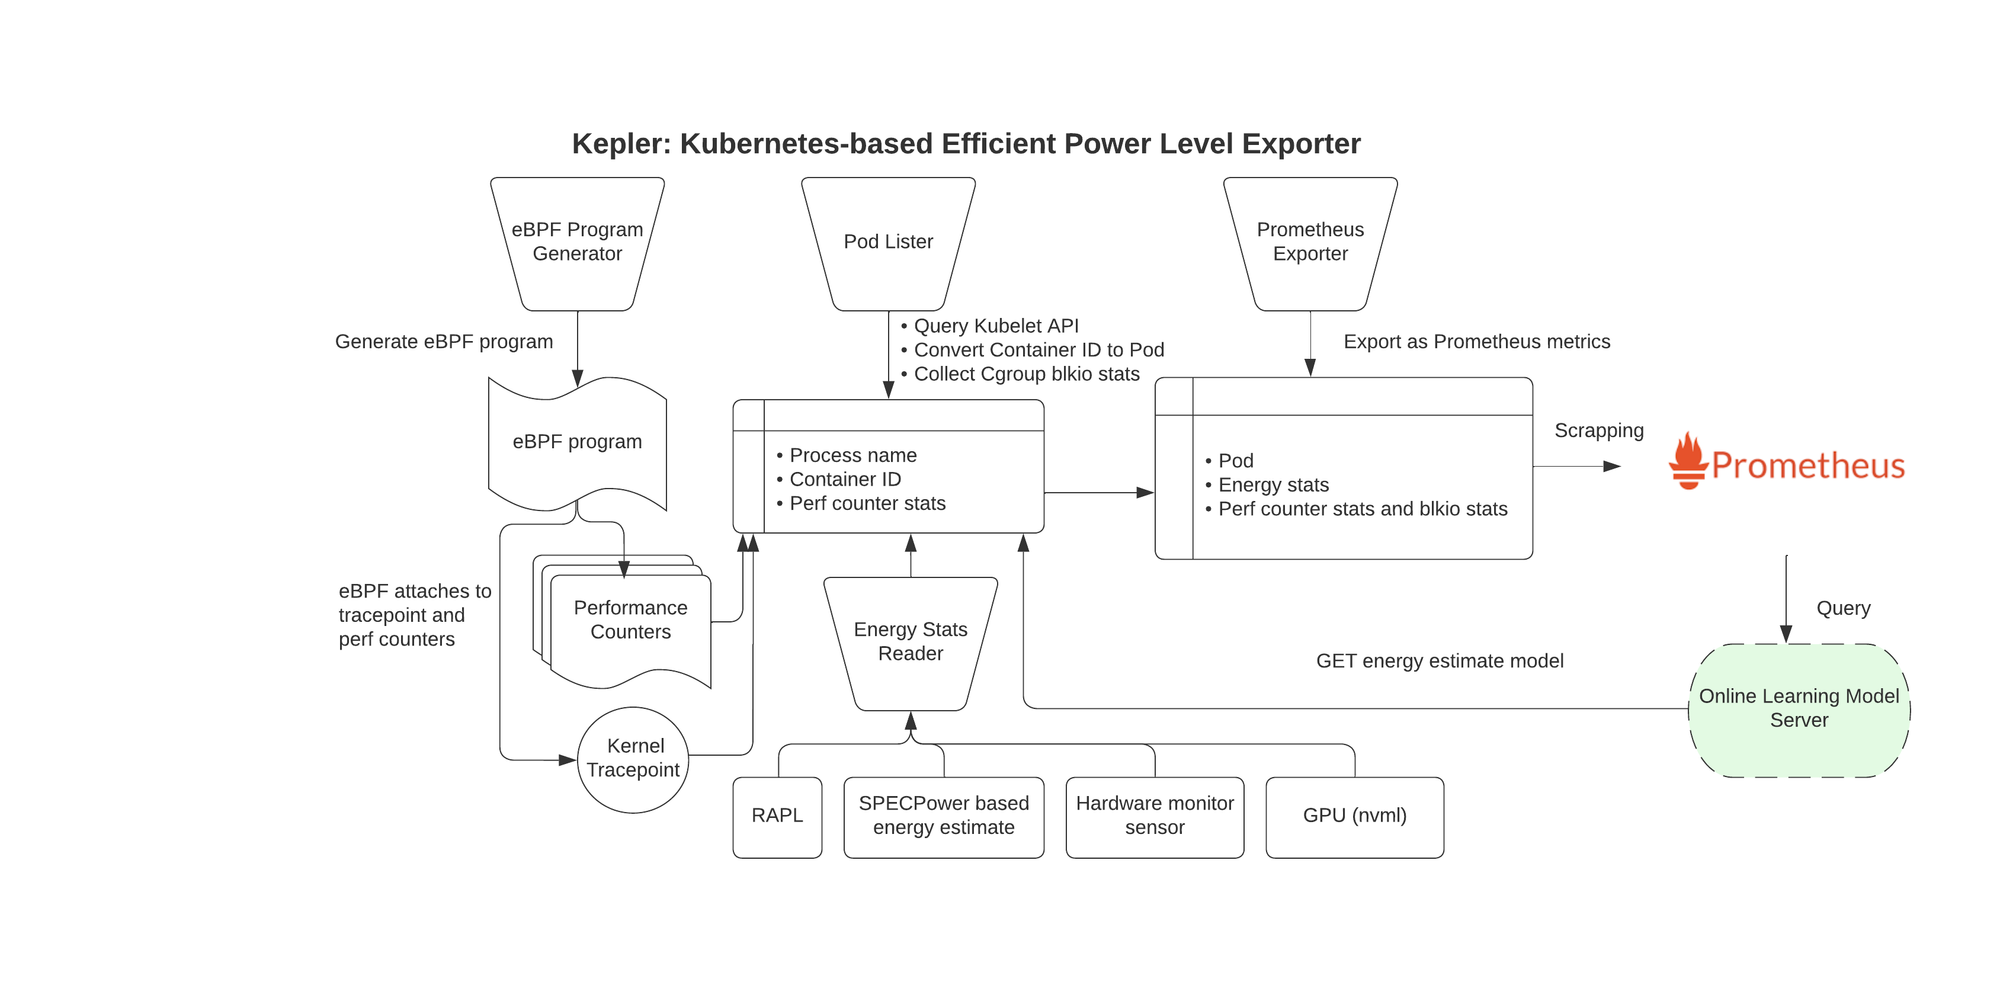
Pretty self-explanatory, one would say. I'm not that person, though. If you are an embedded engineer and know your ways in the workings of Kernel, eBPF, and power consumption stats available through Kernel, you will be able to discern this. If you are like me, on the other hand, (almost) completely unaware of all the previously mentioned stuff, you might have some problems understanding this.
This made me dig a bit deeper into the specs. Here are my findings.
We can group the whole architecture in 4 parts.
The first part is data collection. This is the part that creates the eBPF program, attaches it to the Kernel and reads the energy stats.
The second part is data aggregation. This part queries the kubelet for pod/container information, and aggregates that data with the previously read performance counters and energy stats data.
The third part is data modelling. This part is an additional feature that you can enable by running Kepler Model Server. This server enables tools for power model training, exporting, serving, and utilising, based on Kepler-gathered metrics.
The fourth part is the data presentation. Data is presented, exported as Prometheus metrics, and on the other hand, the data from Kepler Model Server is available for querying and taking actions (e.g. scheduling, etc).
The graph on the page 10 of the presentation linked below helped me understand the Kepler architecture diagram. Check it out to learn more.
 sustainable-computing-io
How to get started with Kepler?
To install Kepler, you'll need a couple of things:
- Working Kubernetes cluster.
- Prometheus (or some other monitoring) stack installed.
Now, the Kepler docs provide instructions on getting started with Kind. I've written about Kind in an article a year and a half ago, and it's great to get you started, fast.
However, for this purpose I've chosen to run my Kubernetes cluster with k3s. I've decided to use this because it's lightweight, and it's a full-blown cluster, suitable for slower machines. And also, I've worked with k3s, so there's that.
Deploying the k3s cluster is a rather simple endeavour. Unless you use PopOS Linux (an Ubuntu-based OS), which doesn't have vxlan kernel module loaded by default.
So, I've followed a k3s quick-start guide, and after an hour, or so, I had a working cluster! On my machine, I did the following:
## Check if the vxlan module is loaded
lsmod | grep vxlan

## If not, enable vxlan module to load from start
cat /etc/modules-load.d/vxlan.conf
# /etc/modules-load.d/vxlan.conf
# Load vxlan driver
vxlan

## Restart your machine to make sure the kernel module is loaded

## Run k3s command to setup the cluster
curl -sfL https://get.k3s.io | sh -s - --write-kubeconfig-mode=644
The above curl command gets the k3s script and sets up your cluster. I've also modified kubeconfig file permissions, in order to be able to access the cluster.
Bonus, troubleshooting command below will let you read logs from the k3s service, if you, hopefully not, need it.
journalctl -u k3s -f
After all this has finished, I had a functioning Kubernetes cluster, running locally with k3s. To verify everything, you can just see if the pods are running with the following commands.
## Set the KUBECONFIG location
export KUBECONFIG=/etc/rancher/k3s/k3s.yaml

## Get all the pods on the cluster
kubectl get pods -A
## Output
NAMESPACE     NAME                                                     READY   STATUS      RESTARTS   AGE
kube-system   local-path-provisioner-6c86858495-wgvs7                  1/1     Running     0          75m
kube-system   coredns-6799fbcd5-zrsl2                                  1/1     Running     0          75m
kube-system   helm-install-traefik-crd-mjf42                           0/1     Completed   0          75m
kube-system   helm-install-traefik-psb6k                               0/1     Completed   1          75m
kube-system   metrics-server-54fd9b65b-jcbvl                           1/1     Running     0          75m
kube-system   svclb-traefik-136ec67f-tlkg8                             2/2     Running     0          74m
kube-system   traefik-7d5f6474df-p4qd2                                 1/1     Running     0          74m
If you have a working Kubernetes cluster, you can skip the above step(s).
Now, on to installing the Prometheus and Kepler. For this, I've followed a comprehensive guide in Kepler docs and installed everything with Helm.
Here are the commands I've executed.
## Install Prometheus on the cluster
helm repo add prometheus-community https://prometheus-community.github.io/helm-charts
helm repo update

helm install prometheus prometheus-community/kube-prometheus-stack \
    --namespace monitoring \
    --create-namespace \
    --wait

## Install Kepler on the cluster
helm repo add kepler https://sustainable-computing-io.github.io/kepler-helm-chart
helm repo update

helm install kepler kepler/kepler \
    --namespace kepler \
    --create-namespace \
    --set serviceMonitor.enabled=true \
    --set serviceMonitor.labels.release=prometheus \
This completed in a couple of minutes, and I had a working monitoring stack, and Kepler exporter in no time!
Add Grafana Dashboard
After you've done with the installation, you'll also need to add a Grafana dashboard for Kepler. To do this, you'll need to port forward your local Grafana, login, and import the Kepler exporter dashboard.
## Make Grafana locally available through browser
kubectl port-forward --namespace monitoring prometheus-grafana-d5679d5d7-sc4d7 3000:3000
Open localhost:3000 in your browser and login to Grafana. Default credentials are admin/promOperator.
After importing the dashboard linked above, you will see somewhat similar to the below.
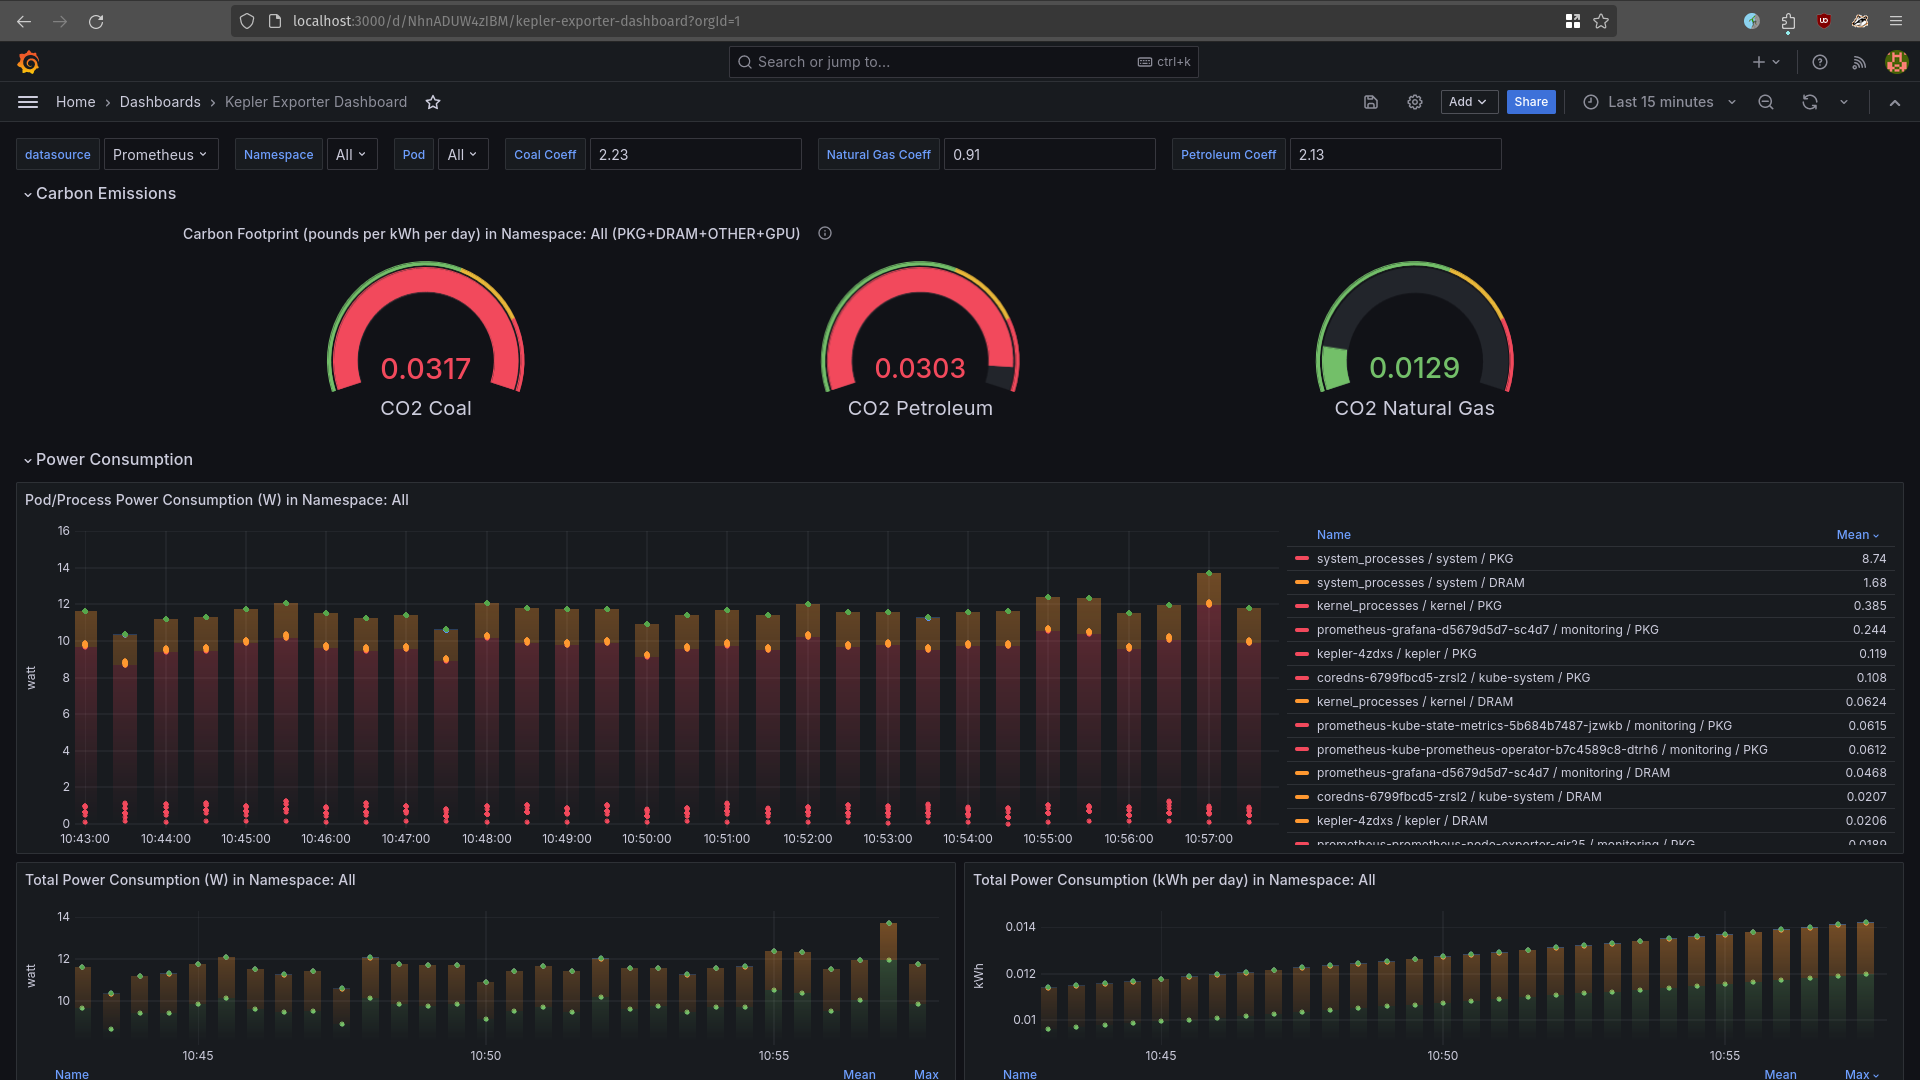
And that's that! You now have an operating Kepler exporter in your cluster. Let's now see what metrics are available, and what all these numbers in the dashboard actually mean.
What is the meaning of this?
To fully answer this question, we would need to really dig deep into our own lives and reflect on the purpose our own has.
Fortunately, the context is a bit different here. We'll stick to answer this question in relation to Kepler exporter and metrics it enables.
Let's start with the basic metrics used in this dashboard.
kepler_container_joules_total- it is the aggregated package/socket energy consumption of CPU, dram, gpus, and other host components for a given container.kepler_container_*_joules_total- where*is one of the following:core- total energy consumption on CPU cores for a certain container;dram- total energy spent in DRAM by a container;uncore- the cumulative energy consumed by certain uncore components (last level cache, integrated GPU and memory controller); the number of components may vary depending on the system;package- the cumulative energy consumed by the CPU socket, including all cores and uncore components;other- energy consumption on other host components besides teh CPU and DRAM;gpu- total energy consumption on the GPUs that a certain container has used.
The most of the metrics are available in Joules - the amount of work done or energy transferred. We would need to convert them in Watts - the rate at which work is done or energy is transferred.
This is all done through the Prometheus function irate(). This function calculates the per-second instant rate of increase of the time series in the range vector. In our case, Joules per seconds.
One additional function used in the dashboards is increase(). This function calculates the increase in the time series in the range vector.
To find out more about Prometheus functions, check out the link below.

The Carbon Footprint is calculated by using the coal, natural gas, and petroleum coefficients from the US Energy Information. These coefficients are in pounds per kWh. To use the metric coefficients, we can consult the 2020 Lifecycle Emissions graph or just convert pounds to grams.
Summary
Exploring and installing Kepler exporter was quite fun and interesting! At least for me. It is a great tool that is installed easily, and it provides you data about the power consumption, which could be of great help!
You can use that data and create some actions - e.g. if a pod is consuming too much energy, see what is the reason and try to decrease the impact. Or run it in a different time frame, if possible. Possibilities are many.
The Carbon footprint part is an estimation, rather than a current state. And it also depends on the sources you get your electricity. But, Grafana allows you to easily adjust and change the dashboard to your own use-case.
In addition, I haven't explored Kepler Model Server in this article. Based on the documentation, it is an interesting feature, that provides tools for model training, exporting, serving, and utilising based on the metrics from Kepler exporter.
And that is all for this article! I hope you liked it and found the information provided useful and interesting.
Leave your comments or thoughts in the comments below. I'll be sure to respond to every one of them. The rule of thumb for sharing this article, is to send it to 5 people, so more will see and learn new stuff.
See you in the next one!